Showing posts with label SSC JE. Show all posts

Friday, 25 March 2022

Irrigation Engineering

👉 Garret's diagram is used to design channels. 

👉Garret's diagram is a graphical representation to obtain canal design parameters based on

  • Kennedy's Theory
  • Kutter's formula 
👉 Lacey's Silt Theory 

Lacey's design is based on stable channels in alluvium and he assumed some bed load and suspended load.

Lacey stated that a channel may not be in regime condition even if it is flowing with non-scouring and non-silting velocity. Therefore, he distinguished three regime conditions as follows :

1. True Regime

2. Initial Regime

3. Final Regime

👉 True Regime: A channel is said to be in regime condition if it is transporting water and sediment in equilibrium such that there is neither silting nor scouring of the channel.  But according to Lacey, the channel should satisfy the following conditions to be in regime condition.

  • Canal discharge should be constant.
  • The channel should flow through incoherent alluvium soil, which can be scoured as easily as it can be deposited and this sediment should be of the same grade as is transported.
  • Silt grade should be constant.
  • Silt charge, which is the minimum transported load should be constant

  • 👉
    Initial Regime: 
    • Channel is said to be in initial regime condition when only the bed slope of channel gets affected by silting and scouring and other parameters are independent even in non-silting and non-scouring velocity condition. 
    • It may be due to the absence of incoherent alluvium. 
    • According to Lacey’s, regime theory is not applicable to initial regime condition.   
    👉 Final Regime: 

    • If the channel parameters such as sides, bed slope, depth etc. are changing according to the flow rate and silt grade then it is said to be in final regime condition. 
    • The channel shape may vary according to silt grade 

    Design Steps:

    Step1: Compute Lacey Silt Factor (f)

                 
       d = average size of particle in mm

    Step 2: Compute Velocity (V)

                  
      Here V = Velocity of flow in m/sec

                Q = Discharge in m3/sec

                 f = Lacey's silt factor

    Step 3: Compute Area of the Channel by using

                                        Q = A.V

    Step 4: Compute wetted perimeter (P) of the channel


    Here, P is the wetted perimeter in m

              Q is the discharge in m3/sec       

    Step 5: Compute Hydraulic radius (R)


              Here R is the hydraulic radius in m

                       V is the velocity in m/sec

                       f is the silt factor

    Step 6: Compute Bed slope (S) by Lacey theory as
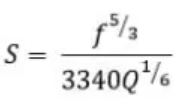


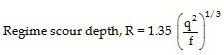
    Note: Lacey Regime Scour depth (R) can be computed as


    👉 Drawback of Lacey Silt Theory:

    • Lacey did not explain the properties that govern the alluvial channel.
    • In general, flow is different at bed and sides of the channel which requires two different silt factors but Lacey derived only one silt factor.
    • The semi-elliptical shape proposed by Lacey as the ideal shape of the channel is not convincing.
    • Lacey did not consider the silt concentration in his equations.
    • Attrition of silt particles is ignored by Lacey.
    • Lacey did not give proper definitions for the silt grade and silt charge.
        

                                     HAPPY LEARNING

    👉 Follow me on talktorashid.blogspot.com


    Thursday, 24 March 2022

    Building Material (Concrete)

     👉 Classification of Concrete

     (a) Based on Bulk density

         Extra light weight ⟶ < 500 kg/m3

         Light weight ⟶ 500 - 1800 kg/m3

         Dense weight ⟶ 1800-2500 kg/m3

        Super heavy weight ⟶ > 2500 kg/m3

    (b) Based on Strength

       Low strength concrete ⟶ < 20 N/mm2

       Medium strength concrete ⟶ 20-40 N/mm2

       High strength concrete ⟶ > 40 N/mm2

    👉 Curing Temperature of Concrete : 5 to 28 degree centigrade

    👉Maturity of Concrete   

    • The strength of concrete depends on both period of curing (i.e age) and temperature during curing.
    • Maturity of Concrete = (Period x temperature)
    • It is measured in °C hours or °C days.
    • The maturity of concrete is defined as the summation of product time and temperature.
    • Maturity = Σ (time x temperature)
    👉Strength of Concrete 

    (a) Compressive Strength Test

    • Test Specimen : 150 x 150 x 150 mm cubes 
                                      : Cylinder of 150 mm diameter and 300 mm height

    • Test specimens are stored at a temperature of 27 ± 3 °C at 90 % humidity for 24 ± 1/2 hour from the time of addition of water to the dry ingredients.
    • 7 days strength of concrete should be at least 2/3 of 28 day strength of concrete.
    • Average of the three values is taken as the compressive strength of concrete, provided the individual variation is not more than ± 15 % of the average.
    • Cube Strength = 1.25 x cylinder strength
    (b) Flexural Tensile Strength Test ( Modulus of Rupture Test)

    • Direct measurement of tensile strength is difficult.
    • Indirect test for assessing the tensile strength of concrete.
    • Concrete is filled in the mould size 150 x 150 x 700 mm
    Modulus of Rupture = p.l / bd2  when a > 200 mm

                                    = 3pa / bd2   when 200 mm > a > 170 mm


    Here,

        a = distance between the line of fracture and the nearest support, measured on the centre line of the tensile side of the specimen (cm)

    b and d is measured width and depth of specimen respectively

    l = length of the span on which the specimen is supported (cm)

    p = maximum load applied to the specimen


    (c) Split Tensile Strength Test

    • Standard test cylinder of concrete specimen of 300 mm x 150 mm diameter is placed horizontally between the loading surfaces of compression testing machine
     

                       Split Tensile Strength (σ ) = 2P / πDL

    Where, P = Applied load

                D = Diameter of the cylinder

                L = Length of the cylinder


    👉 Cube Strength > Cylinder Strength > Modulus of Rupture > Split Tensile Strength

    👉 Generally tensile strength of concrete is 10 % of its compressive strength


                                                    Happy Learning

                                 Please follow me on talktorashid.blogspot.com


    Tuesday, 22 March 2022

    Fluid Mechanics

     Do You Know?

    👉          Device                               Measurement

                Venturimeter                           rate of flow

                 Flow nozzle                           rate of flow

                 Orifice meter                          rate of flow

                 Bend meter                             rate of flow

                 Rotameter                               rate of flow

                   Pitot tube                               Velocity of flow

             Hot wire anemometer                 Air & Gas velocity

             Current meter                             Velocity in open channel

    👉Classification of Jump

    Hydraulic Jump (HJ):  Hydraulic jump is an example of steady rapidly varied flow(RVF)

    Hydraulic jump occurs when a supercritical stream meets a Subcritical stream of sufficient depth.

    👉Classification of jump 

         Type                     Initial Froude Number (F1)                 EL/E1 (%)

    Undular Jump                           1-1.7                                               0

    Weak Jump                             1.7-2.5                                            5 -18

    Oscillating jump                     2.5-4.5                                            18-45

    Steady jump                              4.5-9                                             45-70

    Strong Choppy                          > 9.0                                               > 70


    Saturday, 19 March 2022

    Engineering Hydrology

    👉 Do You Know

    • Tensiometer is used to measure capillary potential
    • Phytometer measures Transpiration
    • Lysimeter measures Evaporation
    • Infiltrometer measures Infiltration
    • Speed of wind is measured using Anemometer.
    • Average annual rainfall over whole of India is 119 cm.
    👉Measurement of Precipitation

    • Rain Gauges
    • Pluviometer
    • Ombrometer
    • Hyetometer
    👉 Types of Gauges

    • Non-Recording Gauges
    (a) The Non-Recording gauge used in India as SYMONS Raingauge

    • Recording Gauges
    (a) Tipping Bucket Type

    (b) Weighing Bucket Type

    (c) Natural Syphon Type

    ⟶ The record from Tipping bucket gives data on the intensity of rainfall

    ⟶Weighing bucket gives the idea of mass curve of rainfall (Plot of the accumulated rainfall against the elapsed time)

    ⟶In India Natural Syphon Type is adopted as Recording Rain Gauge.(This type of gauge gives a plot of the mass curve of rainfall) 

    👉Inconsistency of Records

    Some of the common cause of inconsistency of the records are:

    • Shifting of raingauge station to a new location
    • Neighborhood of the station undergoing a marked change
    • Replacement of old instrument by new one
    • Method of observation 
    👉Inconsistency of record is corrected by using DOUBLE MASS CURVE technique. 

    👉To convert the point rainfall values at various stations into an average value over catchment, several methods are available
    (a) Arithmetical mean method
    (b) Theissen- polygon method
    (c) Isohyetal method

    👉Accuracy: Isohyetal method > Theissen-polygon method > Arithmetical mean method

    👉Frequency of Point Rainfall

    The purpose of the frequency analysis of an annual series is to obtain a relation between the magnitude of the event and its probability of exceedence (P)

    If the annual extreme series is arranged in descending order of magnitude and each position given a number 1 to N, 1 being given to Ist i.e largest value and N given to last value or least value. Then probability P of a rainfall at position m being equaled or exceeded is given by :

                                 Method                                            Probability (P) 
                           
                                 Weibull                                                 m/(N+1)
                                 
                                 California                                                m/N

                                  Hazen                                                     (m - 0.5)/N

                                  Blom                                                    (m-0.44)/(N+0.12)

    👉 Probable Maximum Precipitation(PMP)

    The probable maximum precipitation (PMP) is defined as the greatest or extreme rainfall of a given duration that is physically possible over a basin.

                        PMP =  Mean annual rainfall + k. σ

                            σ = standard deviation of series
                            k = Frequency factor
    👉Isopleth
    A line drawn on the map along which the value of a particular property is uniform .

                 Name                              Isopleth of (i.e line joining places of equal) 

                 ISOBAR                                              Pressure

                ISOBATH                                         Depth in sea
             
                ISOCHRONE                     Travel time from a common centre

                ISOHALINE                                      Salinity

                ISOHELS                                           Sunshine
     
               ISOHYETS                                         Rainfall

                ISONIF                                          Snow fall amount

                ISOTHERM                                     Temperature

    Tuesday, 15 March 2022

    Concrete Technology

    👉 Typical phase composition levels in ordinary Portland cement (OPC)

                   C3S/Alite/Tricalcium Silicate  ⟶  45-60%

                   C2S/Belite/Dicalcium Silicate  ⟶ 15-30%

                    C3A/ Tricalcium Aluminate     ⟶ 6-12%

                    C4AF/Tetra Calcium Aluminoferrite  ⟶ 6-8%

    👉 The crystal structure of different phases are:

                C3S/Alite/Tricalcium Silicate   ⟶ Irregular Structure, Several polymorphs

                C2S/Belite/Dicalcium Silicate  ⟶ Rounded Structures, Several polymorphs

                 C3A/ Tricalcium Aluminate     ⟶ Cubic in pure form

                 C4AF/Tetra Calcium Aluminoferrite  ⟶ Series of solid solution

    👉The temperature at which the reaction occur to form to different phases of cement:

               Formation of C3S  ⟶ > 1250 °C

               Formation of C2S  ⟶  900 - 1200 °C

                Formation of C3A  ⟶ Cooling Stage

               Formation of C4AF  ⟶ Cooling Stage

    👉 Lime saturation factor (LSF) is particularly important because it indicates the amount of free lime. (Too much free lime can cause Unsoundness of the cement).

                                                 LSF = C/ (2.8S + 1.2 A + 0.65 F)

                             C, S, A and F are the % amounts of CaO, SiO2, Al2O3 and Fe2O3

           The range of LSF in between 92 - 98 %

    👉C3S/Alite/Tricalcium Silicate

    • Responsible for early strength development
    • High reactive due to irregular structure, high heat of hydration
    👉C2S/Belite/Dicalcium Silicate

    • Less irregular structure than C3S ⟶Less reactivity
    • Later strength

    Sunday, 13 March 2022

    Environmental Engineering

     👉Conventional Water Treatment

    1. Screening (for the removal of large floating and suspended materials).

    •  Mostly used at intake site
    2.Aeration (for the oxidation of iron and manganese, removal of dissolved gasses and VOCs).
    • Optional unit, and may not be provided if target impurities are not present in water
    3. Sedimentation (for the removal of suspended sediments of specific gravity >1).
    • Plain (or primary) sedimentation may not be provided, as in most cases, settling units are provided after coagulation and flocculation for chemical assisted settling.
    • In many conventional water treatment systems settling unit is combined with flocculation unit, named as clariflocculator.
    4. Coagulation and Flocculation
    Successive steps intended to overcome the forces stabilizing the fine suspended or colloidal particles, allowing particle collision and growth of floc.

    • Destabilization (or Coagulation)
    Reduce the forces acting to keep the particles apart after they contact each other (i.e., lower repulsion forces).
    Chemical Addition, Rapid Mixing, “Pin‐point” Floc Formation
    • Flocculation
    Process of bringing destabilized colloidal particles together to allow them to aggregate to a size where they will settle by gravity.
    Slow Mixing, Floc Growth, Increased Diameter

    Particles in Water
    • Dissolved Solids: < 1 nm (10‐6 mm) in size
    Electrically charged and can interact with the water, so they are completely stable and will never settle out of the water. Not visible even with microscope.
    • Colloidal solids or Non‐settleable solids: 1‐1000 nm in size
    Do not dissolve in water although they are electrically charged. Still, the particles are so small that they will not settle in water and cannot be removed by filtration alone. Can be seen only with a high‐powered microscope.
    •  Suspended or settleable solids: > 1000 nm (10‐3 mm) in size
    Larger particle that can be seen through eyes. These are usually supported by buoyant and viscous forces in water and may settle (or float) in non‐flowing water. Also, these can be removed by simple filtration.

    Coagulation and Flocculation Steps

    Selection of Suitable Coagulant
                             ↓
    Finding Optimum Dose of Coagulant
                             ↓
    Addition of Coagulant and rapid mixing
                             ↓
    Allowing floc formation through slow mixing
                             ↓
    Separation of flocs from water through settling/flotation/filtration

    Selection of Coagulant
    Required Basic Characteristics:
    Nontoxic at the working dosage; High charge density; Insoluble in the neutral pH range
    Aluminum and iron salts are the most commonly used coagulants in water treatment:

    Aluminium coagulants include:                           Iron coagulants include:
    Aluminium sulfate (Alum)                                            Ferric sulfate
    Aluminium chloride                                                     Ferrous sulfate
    Sodium aluminate                                                         Ferric chloride
    Polyaluminum Chloride (PAC)                                Ferric chloride sulfate

    Other coagulants:
    Organic coagulants, polyelectrolytes, hydrated lime, magnesium carbonate and various polymers etc.

    Organic Coagulants vs Inorganic Coagulants

    Organic coagulants
    Generally used for solids & liquids separation and sludge generation. Polyamines function by charge neutralization alone, and are effective at treating higher turbidity raw water and wastewater. Melamine Formaldehydes and Tannins coagulate the colloidal material in the water, as well as absorb organic materials such as oil and grease. These are particularly well suited to operations that generate hazardous sludge.

    Inorganic coagulants
    These are mostly Al or Fe based, and are both cost‐effective and applicable for a broad variety of water and wastewater. Inorganic coagulants are particularly effective on raw water with low turbidity and will often treat this type of water when organic coagulants cannot.

    Advantages of alum are that it readily dissolves with water, and does not cause the unsightly reddish brown staining of floors, walls and equipment like ferric sulphate. However, it is effective only at certain pH range, and good flocculation may not be possible with alum in some waters. With ferric sulphate, coagulation is possible at pH values as low as 4.0, and the floc formed is heavier than alum floc, as well as does not redissolve at high pH values.

    Coagulant Aids
    •  In some waters, even large doses of primary coagulant fails to produce a satisfactory floc. In such cases, the coagulation process is often enhanced through the use of coagulant aids. Coagulant aids also help to create satisfactory coagulation over a broader pH range.
    •  Insoluble particulate materials such as clay, sodium silicate, pure precipitated calcium carbonate, diatomite, and activated carbon are common coagulant aids. They are used in waters that have low concentrations of particles (few nucleating sites). Because their density is higher than most floc particles, floc settling velocity is increased by the addition of such coagulant aids.
    • Polymeric coagulant aid those help in bridging small floc to agglomerate rapidly into larger and denser floc are also used to reduce the amount of primary coagulant required. These are usually slightly anionic polyacrylamides with very high‐molecular weights. In some studies, non‐ionic or cationic types have also been proven effective. Synthetic organics such as anionic polyelectrolyte, and natural organics such as starch, starch derivatives, proteins, and tannins have been used as coagulant aids.
    • The coagulant add dosage must be carefully controlled to avoid lowering the water quality.
    Coagulant Doses: Zones of Effectiveness

    Zone 1: Low dosage, insufficient coagulant added to produce destabilization.
    Zone 2: Dosage sufficient to cause efficient and rapid destabilization
    Zone 3: Dosage high enough to cause restabilization (charge reversal or polymer –foldback)
    Zone 4: Dosage high enough to get sweep floc which results in good destabilization.

    Colloid concentration expressed in terms of surface area S1 < S2 < S3 <S4.


    Coagulation Practices based on Colloids and Alkalinity Levels

    1. High Colloid, low alkalinity: The strategy here is to add coagulant without worrying about pH. The lower pH is better because destabilizing is by charge neutralization. Generally, there is no concern with overdosing because the colloidal surface area is too large.

    2. High colloid concentration, high alkalinity: The choices are to destabilize by adsorption/charge neutralization at neutral pH (a larger dose at higher pH), or add acid to lower pH. Economics dictate choices.

    3. Low colloid concentration , high alkalinity: For this case we can either destabilize by high dosage to give sweep floc or we can add coagulant aid such as bentonite (aluminium phyllosilicate clay) to get destabilization at lower dosage.

    4. Low colloid concentration, low alkalinity: This is the most difficult case and generally requires added alkalinity or collides. Sweep floc is difficult to form as pH drops and it’s easy to overdose at low pH and low colloid concentration.

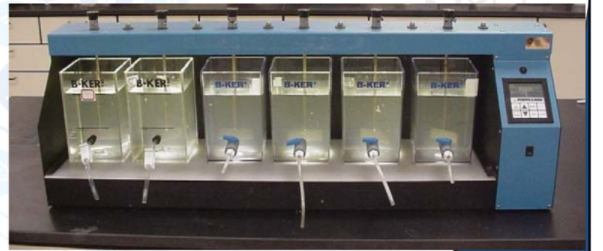
    Coagulant Dose Optimization in Laboratory: Jar Test

    In practice, irrespective of what coagulant or coagulant aid is used, the optimum dose are usually
    determined by a Jar Test. A typical Jar Test apparatus consists of four to six beakers of 1‐2 L volume, provided with a variable‐speed stirrer.

    Procedure: 
    Beakers filled with the raw water and varying amounts of coagulant dose are administered. The contents are rapidly mixed for about a minute and then allowed to flocculate at a slower pre‐worked speed (usually 20‐30 rpm) for desired time (usually 15‐30 mins). Thereafter, the contents are allowed to settle for desired time (usually 20‐ 40 mins), and the optimum dose is determined based on the measured turbidity of supernatant water (alternatively, judgement may be made based on visual inspection).


    Jar test may be used to optimize:
    • pH
    • Mixing Speed for Flocculation
    • Flocculation time

    Importance of Optimum Coagulant Dosing Coagulant over‐dosing may leads to
    o Increased treatment costs
    o Restabilization of colloids
    o Increases sludge mass
    o Public health concerns

    Coagulant under‐dosing may leads
    o Lesser degree of removal
    o Failure to meet the water quality targets


    Friday, 11 March 2022

    Traffic Engineering

     Do You Know?

    👉Various methods of carrying out Speed and Delay study

       (a) FLOATING CAR or RIDING CHECK METHOD

       (b) LICENSE PLATE or VEHICLE NUMBER METHOD

       (c) INTERVIEW TECHNIQUE

       (d) ELEVATED OBSERVATIONS

       (e) PHOTOGRAPHIC TECHNIQUE

    👉Origin and Destination Studies (O & D Data)

    Origin and destination studies of vehicles determines their numbers, origin and destination in the concerned zone of study.

    👉 Methods of collection of O & D Data)

    (a) ROAD SISE INTERVIEW METHOD

    (b) LICENSE PLATE METHOD

    (c) RETURN POST CARD METHOD

    (d) TAG ON CAR METHOD

    (e) HOME INTERVIEW METHOD

    (f) WORK SPOT INTERVIEW METHOD

    👉Representation of O & D Data

    (a) O & D Table

    (b) Desire Lines

    (c) Pie Chart

    (d) Contour Lines

    Note: Desire lines are straight lines connecting the origin points with destinations.

    👉 Accident Studies

    Accident studies are used to find out the reason and cause behind accident and to take preventive measures in term of design control.

    The various records that are maintained in accident studies are:

    (a) Location Files

    (b) Spot Maps

    (c) Condition Diagram

    (d) Collision Diagram

    Thursday, 13 January 2022

    Highway Engineering

     Do you know?

    👉The highway planning surveys consists:

        (i) Economic studies (Population and distribution in each village, trend of population growth, per capita income)

        (ii) Financial studies (Source of income and estimated revenue from taxation on road transport, living standards, future trends in financial aspects)

        (iii) Traffic or road studies (Traffic volume, traffic flow pattern, O and D studies)

        (iv) Engineering studies (Road location and alignment studies, Classification, Types of road in use, Maintenance problems)

    👉 The stages of engineering surveys for highway locations are:

       (i) Map study

       (ii) Reconnaissance

       (iii) Preliminary surveys

       (iv) Final location and detailed surveys

    👉 The following drawing are usually prepared in a highway project:

    (a) Key map (Should show the proposed and existing roads and important places to be connected, the size of the plan should not exceed 22 x 20 cm.)

    (b) Index map (Should show the general topography of the area, size being 32 x 20 cm)

    (c) Preliminary survey plans (details of various alignment, scale: 10 cm = 1km to 25 cm = 1km)

    (d) Detailed plan and longitudinal section 

    (e) Detailed cross-section

    (f) Land acquisition plans

    (g) Drawings of cross drainage and other retaining structures

    (h) Drawings of road intersections

    (i) Land plans showing quarries

    👉 Typical Flexible Pavement Failures:

    (a) Alligator (Map) cracking

    • Most common type of failure and occurs due to relative movement of pavement layer materials.
    • caused by repeated application of heavy wheel loads resulting in fatigue failure or due to moisture variations resulting in swelling and shrinkage of subgrade.
                                                 

    (b) Consolidation of pavement layers
    • Formation of ruts are mainly attributed to the consolidation of pavement layers.

    (c) Shear failure and cracking
    • Shear failure causes upheaval of pavement materials by forming  a fracture or cracking.
    (d) Longitudinal cracking
    • Due to frost action and differential volume changes in subgrade 
    (e) Reflection Cracking
    • observed in bituminous overlays over existing cement concrete pavements
    👉Typical Rigid pavement failures:
    (a) Scaling of cement concrete:
    • scaling is observed in cc pavement showing overall deterioration of the concrete.
    (b) Shrinkage cracks
    (c) Spalling of joint
    (d) Warping cracks
    (e) Mud Pumping
    • Mud pumping is recognized when the soil slurry ejects out through the joints and crack of cc pavements during the downward movement of slab under the heavy wheel load.


    Thursday, 6 January 2022

    Foundation Engineering

     👉 The Primary objective of soil exploration is:

    • Determination of the nature of the deposits of soil, depth and thickness of various soil strata.
    • Location of Ground water table and obtaining soil and rock samples from the various strata.
    •  The determination of the engineering properties of the soil and rock strata that affect the performance of the structure.
    • Determination of the in-situ properties by performing field
    Methods: Test Pits
                     Boring
                     Standard Penetration Test (SPT) [N Value]
                    Cone Penetration Test (CPT): Static cone penetration test (SCPT)[qc value]

                     Dynamic cone penetration test (DCPT)

                     Pressuremeter Test (PMT)
                     Dilatometer Test (DMT)
                     Vane Shear Test (VST)
                    Geophysical Exploration: Seismic reflection survey
                                                             Seismic refraction survey
                                                             Seismic Cross-hole survey
                                                             Resistivity Survey

                  Plate Load Test
                  Pile Load Test


    👉 Standard Penetration Test (SPT): IS 2131-1981
    • The Standard Penetration Test (SPT) is widely used to determine the parameters of the soil in-situ. The test consists of driving a split-spoon sampler into the soil through a bore hole at the desired depth.
    •  The split-spoon sampler is driven into the soil a distance of 450 mm at the bottom of the boring
    • A hammer of 63.5 kg weight with a free fall of 750 mm is used to drive the sampler.
    • The number of blows for a penetration of last 300 mm is designated as the “Standard Penetration Value” or “Number” N.
    • The test is usually performed in three stages. The blow count is found for every 150 mm penetration.
    • The blows for the first 150 mm are ignored as those required for the seating drive.
    • Number of blows for the first 150 mm penetration is disregarded due to the disturbance likely to exist at the bottom of the drill hole
    • The test can be conducted at every 1m vertical intervals (Not more than 1.5 m)
    👉The refusal of test when
    • 50 blows are required for any 150 mm increment.
    • 100 blows are obtained for required 300 mm penetration.
    • 10 successive blows produce no advance.
    👉Two corrections due to:
    (a) Overburden pressure (granular soil)
    (b) Dilatancy (for saturated fine sands and silts)
    👉The corrected N value is given by (overburden correction)
                      
                                       N′ = (CF). N

                     where N′ = corrected value of observed N

                    CF = correction factor for overburden pressure

    👉Dilatancy Correction
                             
                                N′′= 15+0.5(N′-15)       if N′ > 15

    Cone Penetration Test (CPT)
    There are two types of CPT

    (i) Dynamic cone penetration test (DCPT)                 (ii) Static cone penetration test (SCPT)

    Static Cone Penetration Test
    • The Static cone penetration test, which is also known as Dutch Cone test, has been standardized by “IS: 4968 (Part-III)-1976 - Method for subsurface sounding for soils - Part III Static cone penetration test”.
    • The equipment consists of a steel cone, a friction jacket, sounding rod, mantle tube, a driving mechanism and measuring equipment.
    • The cone have an apex angle of 60° ± 15′ and overall base diameter of 35.7 mm giving a cross-sectional area of 10 cm2.
    • The friction sleeve should have an area of 150 cm2 as per standard practice.
    • The sounding rod is a steel rod of 15 mm diameter which can be extended with additional rods of 1 m each in length.
    • The driving mechanism should have a capacity of 20 to 30 kN for manually operated equipment and 100 kN for the mechanically operated equipment.

    Dynamic Cone Penetration Test
    • The dynamic cone penetration test is standardised by “IS: 4968 (Part I) – 1976 - Method for Subsurface Sounding for Soils-Part I Dynamic method using 50 mm cone without bentonite slurry”.
    • The equipment consists of a cone, driving rods, driving head, hoisting equipment and a hammer.
    • The hammer used for driving the cone shall be of mild steel or cast-iron with a base of mild steel and the weight of the hammer shall be 640 N (65 kg).
    • The cone shall be driven into the soil by allowing the hammer to fall freely through 750 mm each time.
    • The number of blows for every 100 mm penetration of the cone shall be recorded.
    • The process shall be repeated till the cone is driven to the required depth.


    Saturday, 1 January 2022

    Environmental Engineering

     👉Fluctuations in water demand:

    • In India  the maximum daily demand of water is generally taken as 180% of the annual average daily demand of water ( peak factor = 1.8 ) 
    • In India the maximum hourly demand of water is generally taken as 150 per cent of the hourly demand on the day of maximum use of water ( or the maximum day for the year). [Peak Factor = 1.5]
    • Average Daily per capita Demand = Quantity required in 12 months / (365 x population)
    • Maximum daily demand = 1.8 x average daily demand.
    • Maximum hourly demand of maximum day i.e. Peak demand = 1.5 x average hourly demand on a maximum day

                                                                  =     2.7 x annual average hourly demand

    👉 Water Quality Parameters

     1.Conductivity or Electrical Conductivity (EC): is the ability of water to carry an electrical current. Pure water is a poor conductor of electricity and water shows significant conductivity when dissolved salts are present (generally, directly proportional to the amount of salts dissolved in the water). It is measured using conductivity sensors, and is expressed as siemens/meter (S/m).

     2.Colour: It is an important from the standpoint of aesthetics. Colour in water is often caused by organic substances such as algae or humic compounds. The colour could be Apparent (caused by suspended matter) or True (caused by dissolved or colloidal solids).

    For measurement purpose, the colour produced by 1 mg/L of platinum (as K2PtCl6) and 0.5 mg/L of

    cobalt (as CoCl2•6H2O) is taken as the standard one unit of colour, and a sequential dilution method

    may be followed to determine the colour in standard colour units. Spectrophotometric determination of colour in the form of absorbance at select wavelength is also getting popular.

    2. Odour: in water is objectionable. Pure water is odourless, but water may acquire odour when some

    substances are dissolved. Decayed organic substances give fouling smell while inorganic substances

    give earthy smell. 

    • Odour is measured through Threshold Odour Test, where dilution factor is determined to make the water odourless.
    • Threshold Odour Numbers (TON) can be computed as:

                = (Volume of Sample + Volume of Pure Water needed to remove any odour)/Volume of Sample

    3. Turbidity: is an optical property, describing the clarity, or haziness of the water caused by the presence of very fine suspended or colloidal particles (typically not filterable by routine methods). Turbid waters are unacceptable to consumers. Turbidity may also affect the treatability of waters.

    • Turbidity is measured through passing a beam of light through the sample, and recording its scattering. The quantity of light scattered is dependent upon the concentration and size distribution of the particles.

    a) In turbidimetry, the intensity of light transmitted is measured.

    b) In nephelometry the intensity of the light scattered at 900 is measured.

    4. Hardness: in water is caused by the presence of Ca2+ and Mg2+ ions as Hydrogencarbonate ‐ Ca(HCO3)2, Mg(HCO3)2 ; Sulphates‐ CaSO4, MgSO4 ; Chloride ‐ CaCl2, MgCl2 etc. Bicarbonates of Ca and Mg leads to Temporary Hardness, while sulphates/chlorides/nitrates of Ca and Mg leads to Permanent Hardness.

    • Hardness is most commonly measured by titration with an EDTA solution, however test strips or

    instruments separately measuring Ca and Mg are also being used. Hardness can also be collocated

    using ion balance where equivalence of Ca2+ and Mg2+ are estimated after converting each ion as mg/L of CaCO3.

    5. Solids : refers to the mass of solids present in the water. The Total Solids (TS) mass present in the water could be in suspended or dissolved state, and could be volatile or fixed by nature. Based on these different measures of solids are estimated. The measurements are done using gravimetric analysis.

    • Inorganic salts in water often remains in dissolved state and are non‐volatile even at high temperatures, therefore contributes to Fixed Dissolved Solids (FDS). While, Fixed Suspended Solids (FSS) are inorganic particles suspended in the liquid; such as undissolved salt crystals and silt particles.
    • Organic compounds are often volatile at high temperature. The dissolved organics e.g. sugars, fatty acids etc. constitutes Volatile Dissolved Solids (VDS), while suspended organics and microorganisms constitute Volatile Suspended Solids (VSS).
    • Sum of FDS and VDS forms Total Dissolved Solids (TDS), while sum of VSS and FSS is called Total Suspended Solids (TSS).  

    6. Most Probable Number (MPN) : is most commonly applied parameter for microbial quality testing of water. Fecal coliforms act as an indicator for fecal contamination of water.

    Thursday, 5 August 2021

    Target GATE & ESE 2022 (Strength of Material)

     👉Elongation in prismatic bar 

                            △ = ү.L^2/2E

                            △ = WL/2AE

    Here, △ = elongation in prismatic bar

               L = length of bar

               W = self weight of the bar = ρ.A.L

              E = young's modulus of elasticity

              ү = Unit weight of material

    👉 Elongation in conical bar

                   ∆ = ү.L^2/6E

    👉 Elongation in conical bar due to self weight is one third of elongation in prismatic bar due to self weight. 

    👉 Important Relationship

        E = 2N (1+μ)

       E = 3K(1-2μ)

       μ = (3K-2N)/(6K+2N)

       E = 9KN/3K+N

    where,

            N = Modulus of rigidity/Shear Modulus

            K = bulk modulus

            E = Modulus of elasticity/ Elastic modulus

            µ = Poisson's ratio ( 0 to 0.50)

    👉   Modulus of Resilience is energy stored upto elastic limit per unit volume.

    👉       △Sudden = 2.△static

    👉 strain is the fundamental behaviour but stress is a derived concept because strain can measured with some instrument  and is a fundamental quantity however stress can only be derived , it can not be measured.

    👉 If loading of nth degree, then shear force diagram is of (n+1) degree and bending moment diagram  is of (n+2) degree

    👉For bending moment M to be maximum

         dM/dx =0 and we know dM/dx  = Shear force (V)

        Bending moment is maximum at the section where shear force is zero or changes sign.

    👉        dM/dx = V       (Slope of Bending moment = shear force)

                 dV/dx  = w        (Slope of shear force = loading intensity)

                 M = ∫ V dx

                 V  = ∫ w dx

                 d2M/dx2 = dV/dx  = w

       M = Bending moment

       V = shear force

       w = loading intensity

     👉Point of contra-flexure is the point where bending moment changes it's sign

    👉        Real Beam             Conjugate Beam

            Hinged Support              Hinged Support

            Free Support                  Fixed support

            Fixed support                  Free support

            Internal roller                  Internal hinge

            Internal hinge                  Internal roller


                                                    Happy Learning

                                 
                                      Please follow me on talktorashid.blogspot.com

    Wednesday, 4 August 2021

    Target GATE & ESE 2022 (Geomatics Engineering)

     👉The correct sequence of the survey is

        (a) Traffic survey

        (b) Reconnaissance survey

        (c) Preliminary survey

        (d) Detailed survey or location survey

    👉Topographical survey is done to determine information about man made and natural features on earth surface including their elevations.

    👉Reconnaissance survey is a kind preliminary survey which is performed to find out method of survey to be adopted and its rough cost.

    👉Cadastral survey is done to establish property boundaries.

    👉Archaeological survey is done to collect information about old and relic structures.

    👉 Transverse surveying is done with the help of compass and chain.

    👉Geodetic surveying (Curvature of earth is taken into account) is done with the help of precise instruments such as Theodolite 

    👉Weddle sounding machine is used to determine depth of sea in hydrographic surveying.

    👉The principal of surveying is work from whole to part.

    👉 Various instruments used in surveying and their purpose:

    • Pegs: To mark survey station and end points of survey lines on the ground
    • Ranging Rod: For locating a number of points on a long survey line
    • Offset rods: To set out offset line at right angles
    • Prism Square: Setting out right angles
    • Clinometer: To measure the slope of ground
    • Optical Square: To set out right angles
    • Prismatic Square: Advanced version of Optical Square and used to set out right angles
    • French Cross Staff: Used to set out either 45 degree or 90 degree
    • Open Cross Staff: Type of cross staff which is also used to set out 90 degree
    • Theodolite: To measure of all horizontal and vertical angles
    • Dumpy Level: Measurement of angle and elevation
    • Auto Level: For Levelling purpose

                                                                        Fig 1.  Optical Square


                                                                  Fig.2 French Cross Staff
    👉Offsets are lateral measurement made w.r.t main survey line which may be oblique or perpendicular in nature.

    👉The main objectives of cross staff survey is:
    • To locate boundaries of an area
    • To plot the figure to a scale
    • To find area of the piece of land to be surveyed.  
    👉Methods commonly used in reconnaissance surveying for measurement of horizontal distance are:
    • Pacing
    • Passometer
    • Pedometer
    • Odometer
    • Measuring wheel
    • Speedometer
    • Perambulator

                                                                      Fig 3. Passometer


     Fig 4. Pedometer


    Happy Learning

    Please follow me on talktorashid.blogspot.com

    Saturday, 31 July 2021

    Target GATE & ESE 2022 Revision Test

     Q.1 A stream function is given by ψ = 3x^2 -y^3. What is the magnitude of velocity components at the point (2,1) ?

    (a) 8.52                                  (b) 9.17

    (c) 10.81                                (d) 12.37

    Q.2 What is the minimum size of glass tube that can be used to measure water level if the capillary rise in the tube is to be restricted to 2 mm ? (Take surface tension of water in contact with air as 0.073575 N/m)

    (a) 1.5 cm                               (b) 1.0 cm

    (c) 2.5 cm                               (d) 2.0 cm

    Q.3 What is the hydraulic radius of a stable canal carrying a discharge 0f 27 m^3/s using Lacey's method? (Assume silt factor is unity)

    (a) 1.44 m                               (b) 2.67 m

    (c) 3.14 m                               (d) 4.28 m

    Q.4 Which one of the following is the correct assumption of Rankine's theory?

    (a) The soil mass is infinite

    (b) The soil mass is non homogeneous

    (c) The soil mass is cohesive

    (d) The ground surface is a plane which may be horizontal or inclined

    Q.5 Which one of the following is not an instrument for setting out right angles?

    (a) Cross staff                        (b) Site square

    (c) Prism square                    (d) Optical square

    Q.6 The hardness of aggregate is tested by

    (a) Impact test                      (b) Crushing strength test

    (c) Abrasion test                   (d) Soundness test

    Q.7 The drawback of electric seasoning of timber is

    (a) Checks                      (b) Splitting

    (c) Cracks                       (d) Reduced Strength

    Q.8 Pozzolanas are

    (a) argillaceous materials 

    (b) calcareous materials

    (c) accelerators

    (d) siliceous materials

    Q.9 A plane element in a body is subjected to a tensile stress of 100 MPa and shear stress of 25 MPa. What is the normal stress on a plane inclined at 15 degree with the tensile stress?

    (a) -5.8 MPa                    (b) -4.8 MPa

    (c) -3.8 MPa                   (d) -2.8 MPa

    Q.10 If the pressure head of water is 100 m and specific gravity of kerosene is 0.81, what is the pressure head of kerone?

    (a) 123.5 m of kerosene             (b) 241.3 m of kerosene

    (c) 75.1 m of kerosene               (d) 52.4 m of kerosene


                                            Please Follow me on talktorashid.blogspot.com


    Wednesday, 28 July 2021

    Target GATE & ESE 2022 (Fluid Mechanics)

     Do You Know?

    👉

    • Hot Wire Anemometer: It is used for measurement of instantaneous velocity and temperature at a point in flow but it is an ideal tool for measurement of velocity fluctuations in time in turbulent flow.
    • Orifice Meter: It is cheap device which is used to measure the volume flow rate means discharge.
    • Pitot Tube: Used for measurement velocity of flow.
    👉     Preston Tube: Used for Boundary shear stress measurement.     

    👉     Submerged broad crested weir  (Cd = 0.83 to 0.85)

    👉          Free broad crested weir ( Cd = 0.85 to 1)

    👉       For ogee spillway ( Cd = 1.19 Cds), where Cds is the discharge coefficient for sharp crested weir. 

    👉       Cd value increases for ogee due to adhering Nappe

    👉 Rehbock formula gives the expression for discharge over a rectangular suppressed weir.

                                      Q = 2/3 (0.605 + 0.08 H/Z + 0.001/H) sqrt (2g). BH^1.5 

     👉 Francis found that due to end contraction the effective width of the nappe is reduced by o.1H.

                                                                  Leff = (L - 0.1 nH)

    👉 Cipolletti notch (or weir) is a trapezoidal notch which gives discharge equal to the discharge that would pass over a rectangular notch. 

                                                         Q = 2/3 Cd sqrt(2g) LH^1.5

    👉 Ventilation of Nappe: When there is no ventilation of nappe, discharge increases because the Nappe is pulled down due to negative pressure created in the zone below nappe.

    👉  Let Q be the discharge in free Nappe then

            For depressed Nappe Qd = (1.06-1.07) Q

            For Adhering Nappe  Qa = 1.25 Q

    👉 Orifice is an opening in the tank and Mouthpiece is short length of tube

    👉 Coefficient of resistance of Orifice (Cr) is defined as the ratio of Loss of KE through orifice to actual KE.

                                                   Cr = (1/Cv^2 -1)

          where Cv is the coefficient of velocity. 


              If you really like this please follow me on                            talktorashid.blogspot.com


    Monday, 26 July 2021

    Target GATE & ESE 2022 (Fluid Mechanics)

     Q.1 The range of coefficient of discharge for a venturimeter is 

    (a) 0.6-0.7             (b) 0.7-0.85            (c) 0.85-0.92              (d) 0.92-0.98


    Q.2 A rotameter is used to measure:

    (a) viscosity of fluids

    (b) density of fluids

    (c) flow rate of fluids

    (d) rotational energy of a fluid


    Q.3 Notch is a device used for measuring

    (a) rate of flow through pipes

    (b) rate of flow through a small channels

    (c) flow velocity through a pipe line

    (d) flow velocity through a small channel


    Q.4 A cipolletti weir is:

    (a) a rectangular weir of varying dimension

    (b) a weir is designed for economical discharge

    (c) a combination of a rectangular and triangular weir

    (d) a trapezoidal weir whose side slopes are one horizontal to four vertical


    Q.5 In a rectangular weir, the discharge varies as:

    (a) H               (b) H^0.5       (c) H^1.5            (d) H^2.5


    Q.6 The sheet of water flowing through a notch or over a weir is known as

    (a) Nappe            (b) Crest            (c) Height of weir/notch     (d) Sill


    Q.7 If the error in the measurement of head in a rectangular notch is 1% , then error in the measurement of discharge will be

    (a) 1%                                                    (b) 1.5%

    (c) 2%                                                   (d) 2.5%

    Wednesday, 16 June 2021

    Target GATE & ESE 2022 (Fluid Mechanics)

     Q.1 If the velocity of flow as well as the diameter of the flowing pipe are respectively doubled through a pipe system in use since long, the head loss will thereafter be

    (a) Halved    (b) Doubled          (c) Increased 4 times       (d) No change

    Q.2 Two tanks are connected in parallel by two pipes A and B of identical friction factors and lengths. If the size of pipe A is double that of pipe B, then their discharges will be in the ratio of

    (a) 2           (b) 4     (c) 5.66           (d) 32

    Q.3 In steady flow of a compressible fluid through a pipe, the density, area and velocity at a particular section are 1.5 kg/m^3, 0.5 m^2 and 3 m/s, respectively. At another section the density and area are 0.75 kg/m^3 and 1.0 m^2 respectively. What is the velocity at this section?

    (a) 1.5 m/s          (b) 3.0 m/s           (c) 4.5 m/s          (d) 6.0 m/s

    Q.4 A pipe network consist of a pipe of 60 cm diameter and branches out at a point F into two branches, one of 30 cm diameter and the other of 45 cm diameter. These branch pipes rejoin at a point B. The velocity in the first branch (of 45 cm diameter) is 1.5 m/s. Which one of the following statements is true?

    (a) The velocity in second branch is 1.0 m/s

    (b)  The velocity in second branch is 2.25 m/s

    (c) The velocity in second branch is 0.667 m/s

    (d) The potential drop between F and B in both branches is same

    Q.5 A compound pipe (new cast iron) system consists of pipes of length 1800 m and diameter 50 cm, length 1200 m and diameter 40 cm and length 600 m and diameter 30 cm connected in series. The equivalent length of 40 cm diameter pipe will be nearly

    (a) 4300 m                   (b) 4400        (c) 4500 m               (d) 3600  


                                                Happy Learning

    Tuesday, 15 June 2021

    Target GATE & ESE 2022 (Irrigation Engineering)

     Q.1 Assertion(A): Duty is an expression of the irrigation capacity of a unit volume of water.

            Reason(R): Duty at the head of a distributary will be less than that at the head of a watercourse and more than that at the head of a canal.

    (a)               (b)                (c)                  (d)

    Q.2 The delta for a crop having base period 120 days is 70 cm. What is the duty in hectare/cumec

    (a) 2480        (b) 1481          (c) 148        (d) 1.481

    Q.3 The CCA for a distributary is 200000000 m^2. The intensity of irrigation for a crop is 40%. If KOR water depth and KOR period for the crop are 14 cm and 4 weeks, respectively, the peak demand discharge (in cumec)

    (a) 2.63          (b) 4.63          (c) 8.58        (d) 11.58

    Q.4 The two columns below show some parameters and their possible values:

         Parameters                                        Value 

    P.        GCA                                          i. 1000 ha/cumec

    Q. Permanent wilting point                 ii. 6 degree centigrade

    R. Duty of canal water                        iii. 1000 hectares

    S. Delta of wheat                                iv. 1000 cm

                                                                 v. 40 cm

                                                                vi. 0.12

    Which of the following options matches the parameters and the values correctly?

    (a) P-i, Q-ii, R-iii, S-iv

    (b) P-iii, Q-vi, R-i, S-v

    (c) P-i, Q-v, R-vi, S-ii

    (d) P-iii, Q-ii, R-v, S-iv

    Q.5 The total irrigation depth of water required by certain crop in its entire growing period (150 days) is 25.92 cm. The CCA  for a distributary channel is 100,00 ha. The distributary channel shall be designed for a discharge

    (a) less than 2 cumecs

    (b) 2 cumecs

    (c) 20 cumecs

    (d) more than 20 cumecs

    Sunday, 13 June 2021

    Target GATE & ESE 2022 (Fluid Mechanics)

     Do you know?

    👉Pressure gradient in the direction of flow (∂p/∂x) is equal to the shear gradient normal to the direction of flow (∂τ/∂y).

                                                ∂p/∂x  =   ∂τ/∂y        

    👉 Hele Shaw Flow: Laminar flow between parallel plates

          Stoke's Law: Settling of fine particles

          Hagen Poiseuille Flow: Laminar flow in tubes/pipes

    👉Bulk modulus(k) is a measure of compressibility of fluid. It is the ratio of change in pressure (△P) to change in volume per unit volume (∆V/V). It is also called ratio of pressure to volumetric strain.

    👉 Various factors that affect bulk modulus:

        > As pressure of fluid increases, bulk modulus of elasticity of fluid increases.

        > With increase in temperature of a liquid the bulk modulus of liquid decreases.

        > With increase in temperature of a gas the bulk modulus of gas increases

    .👉Streak line is formed by continuous introduction of dye or smoke from a pont in the flow.

    👉 For steady flow ⟶ Stream line, Path line and Streak line are same.

    👉Cauchy-Riemann Equation 

    > Velocity potential function exists only for irrotational flow.

    > Stream function exists both for rotational & irrotational flow.

    > Both velocity potential and stream function for irrotational flow satisfies laplace equation.

    > For irrotational incompressible flow 

                   u = -∂Φ/∂x = -∂Ψ /∂y

                   v = -∂Φ/∂y = ∂Ψ /∂x

    👉Flow Net

    ◘ A line along which stream function is constant is called stream line (ψ = Constant)

    ◘ A line along which velocity potential is constant is called equipotential line ( Φ = constant)

    ◘ A grid obtained by drawing series of equipotential lines and stream lines is known as flow net.

    ◘Flow net is drawn in such a way that difference between stream function stream function of two successive stream lines are same. Discharge between two successive stream line is constant in a flow net.


    👉 Methods of drawing Flow Net

    ◘  Analytical method

    ◘  Hydraulic models

    ◘ Graphical method

    ◘ Electrical analogy method

    👉 Use of Flow Net

    ◘  Determine uplift pressure on the bottom of a dam

    ◘  Loss of flow due to seepage in earth dam  

    ◘  Determine the stream line and equipotential lines.


                                                        Happy Learning